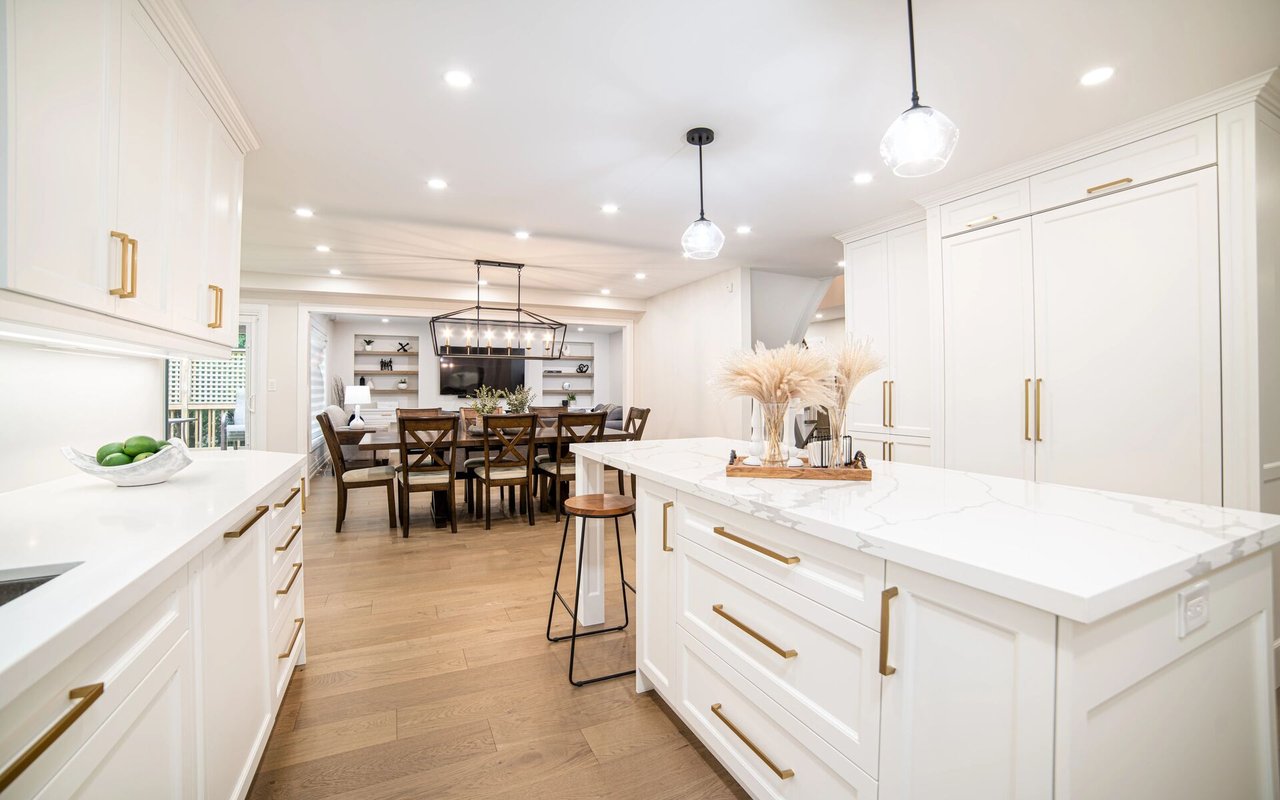
Bright white kitchen with a marble island, brass hardware, and an adjoining dining area.

San Francisco Home Prices, Market Conditions & Trends March 2025

Market activity and demand – as defined by listings going into contract, speed of sale, and overbidding of list price – rose in February. Unlike other Bay Area markets, San Francisco has not seen a substantial increase in the number of homes for sale.
 
San Francisco Real Estate March 2025 Report cover featuring the Golden Gate Bridge and COMPASS branding.
 
March 2025 San Francisco real estate market report with February commentary and Compass branding.
 
Line chart compares Nasdaq and S&P 500 gains from January 2024 to March 6, 2025, showing volatility and overall growth.
 
Chart of San Francisco median house prices since 1990, with the 2022 peak and market-event annotations.
 
San Francisco median home sale price appreciation chart, showing changes over periods from one to 25 years.
 
Chart of weekly 30-year mortgage rates from 2023 to March 2025, with rates declining to 6.63%.
 
Infographic comparing San Francisco home sales and median prices by construction era.
 
San Francisco condo price chart from 2005 to 2025, with a 10% year-over-year decline noted for February 2025.
 
Chart of San Francisco condo price appreciation, showing changes from 1% over one year to 182% over 25 years.
 
Chart comparing median two-bedroom condo prices in downtown and non-downtown San Francisco, 2005–2025.
 
Chart comparing San Francisco condo and house median prices per square foot from 2005 to 2025.
 
San Francisco residential market infographic comparing price segments and property types, with listings, sales, and inventory data.
 
Chart of San Francisco new listings, January 2021–February 2025, showing recurring seasonal peaks and a slight February dip.
 
San Francisco active and coming-soon home listings by month, February 2022 to March 2025.
 
Chart of San Francisco listings going into contract, showing monthly seasonality from August 2021 through February 2025.
 
Chart of San Francisco monthly listing absorption rates, showing an overall rise to about 25% in February 2025.
 
Chart of monthly San Francisco home sales, January 2020–February 2025, with sales volume and seasonal market notes.
 
Chart of San Francisco luxury home sales since 2018, with pandemic-era peaks and data updated through February 2025.
 
Bar chart of San Francisco luxury condo and co-op sales, with a 60% year-over-year increase in early 2025.
 
Bar chart of San Francisco active-listing price reductions from 2018 to 2025, with seasonal peaks and a February 2025 increase.
 
San Francisco chart of average days on market for houses and condos, January 2021 through February 2025.
 
Chart of San Francisco home sales closing over list price, with rates from 2020 through February 2025.
 
San Francisco house and condo sale prices versus original list prices, charted from January 2020 through February 2025.
 
VIX volatility index chart from September 2022 to February 2025, with a sharp spike in August 2024.
 
Real estate market statistics notes explaining data, median sales price, and dollar per square foot, followed by credits and disclaimers.

Work With Amanda

Amanda Sharp is dedicated to helping you find your dream home and assisting with any selling needs you may have. Contact Amanda today to start your home searching journey!

Follow Me on Instagram